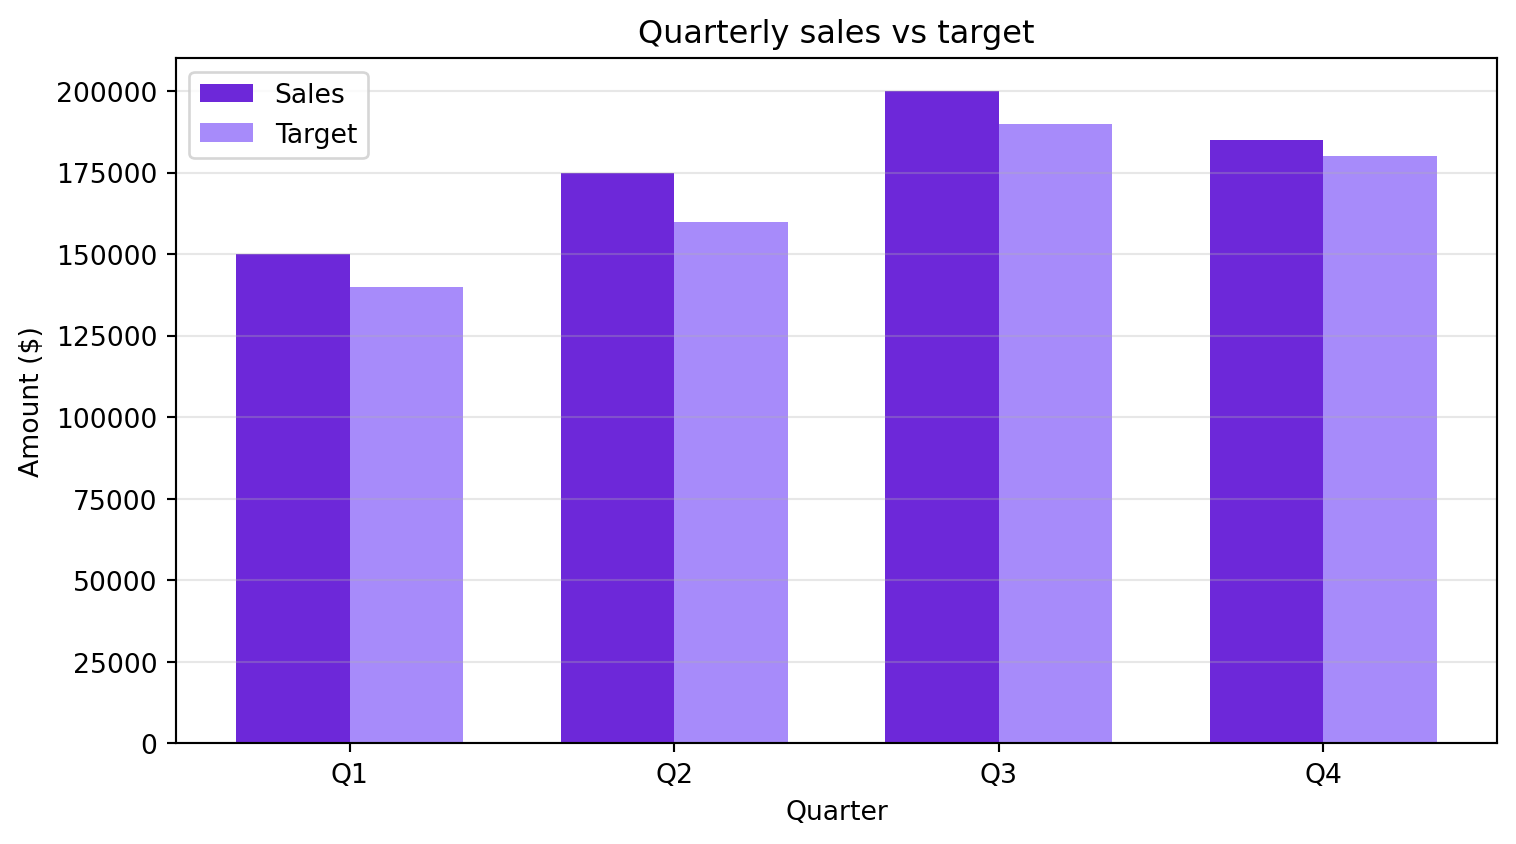
Combine what you practised: build a table, compute new columns and draw a comparison chart. The figures are example data.
Build the table
import pandas as pd
import matplotlib.pyplot as plt

quarters = ["Q1", "Q2", "Q3", "Q4"]
sales = [150000, 175000, 200000, 185000]
targets = [140000, 160000, 190000, 180000]

performance = pd.DataFrame({"Quarter": quarters, "Sales": sales, "Target": targets})
performance["Performance %"] = (performance["Sales"] / performance["Target"] * 100).round(1)
performance["Gap"] = performance["Sales"] - performance["Target"]
print(performance)
  Quarter   Sales  Target  Performance %    Gap
0      Q1  150000  140000          107.1  10000
1      Q2  175000  160000          109.4  15000
2      Q3  200000  190000          105.3  10000
3      Q4  185000  180000          102.8   5000
Compare sales and target
fig, ax = plt.subplots(figsize=(8, 4.5))
x = range(len(quarters))
width = 0.35

ax.bar([i - width / 2 for i in x], sales, width, label="Sales", color="#6D28D9")
ax.bar([i + width / 2 for i in x], targets, width, label="Target", color="#A78BFA")
ax.set_xlabel("Quarter")
ax.set_ylabel("Amount ($)")
ax.set_title("Quarterly sales vs target")
ax.set_xticks(list(x))
ax.set_xticklabels(quarters)
ax.legend()
ax.grid(axis="y", alpha=0.3)
plt.tight_layout()
plt.show()
Take it further
- Add a column that marks each quarter as “above” or “below” target.
- Change one target and check how the chart and the gap change.
- Repeat the analysis with a dataset that interests you.