import pandas as pd
import matplotlib.pyplot as plt

df = pd.DataFrame({
    "Month": ["January", "February", "March", "April"],
    "Sales": [15000, 18000, 22000, 19000],
})Lesson 3 · Data visualization
Your first charts with matplotlib
We reuse the example table from lesson 2.
Your first chart
plt.figure(figsize=(8, 4.5))
plt.bar(df["Month"], df["Sales"], color="#6D28D9")
plt.xlabel("Month")
plt.ylabel("Sales ($)")
plt.title("Monthly sales")
plt.grid(axis="y", alpha=0.3)
plt.tight_layout()
plt.show()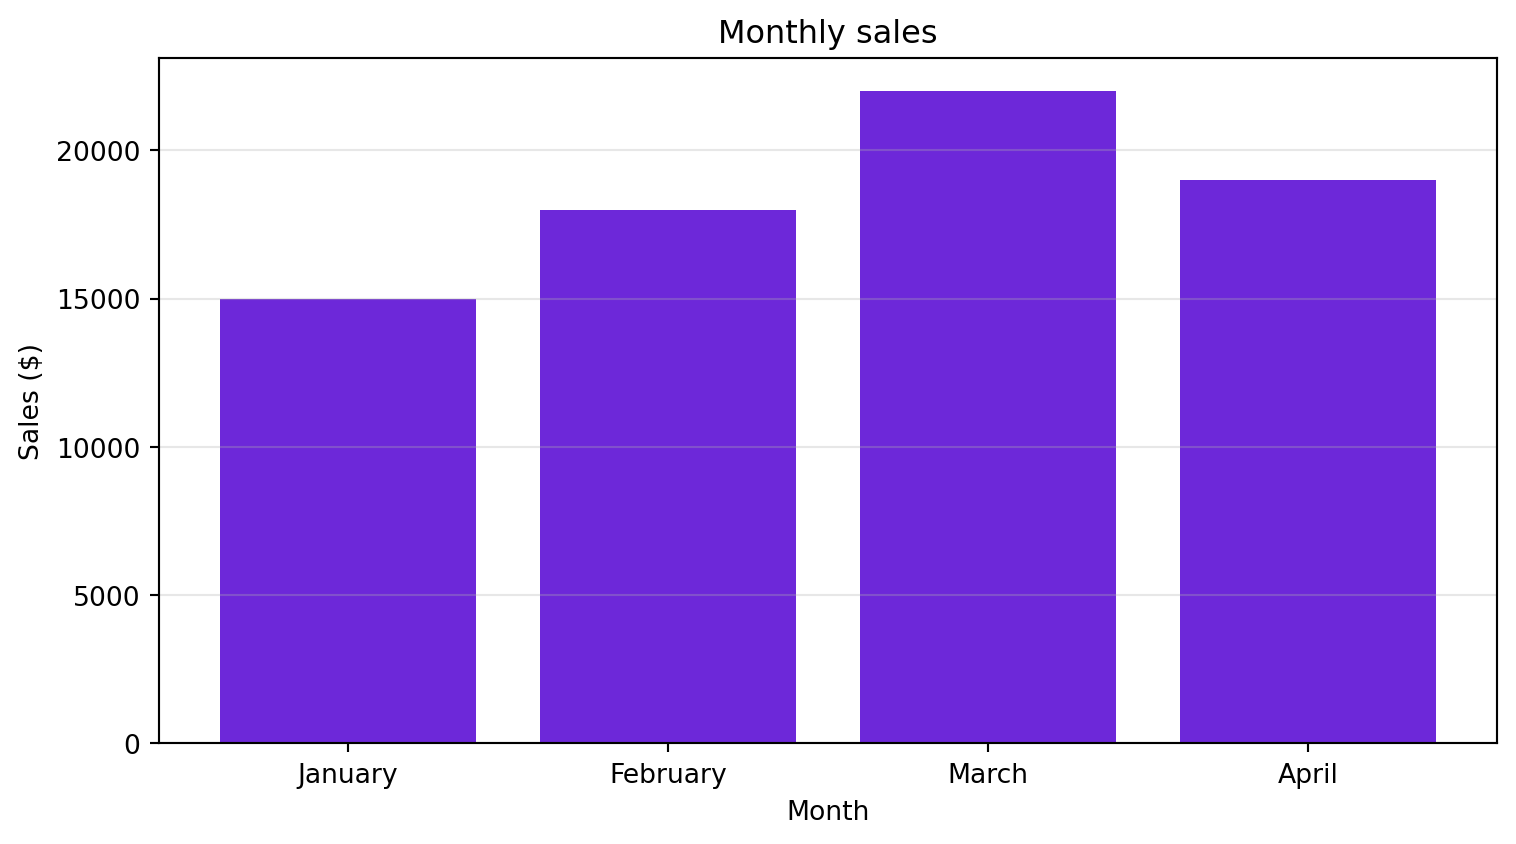
Two views of the same data
fig, (ax1, ax2) = plt.subplots(1, 2, figsize=(11, 4.5))

ax1.bar(df["Month"], df["Sales"], color="#6D28D9")
ax1.set_title("Monthly sales")
ax1.set_ylabel("Sales ($)")

ax2.pie(df["Sales"], labels=df["Month"], autopct="%1.1f%%")
ax2.set_title("Share of total sales")

plt.tight_layout()
plt.show()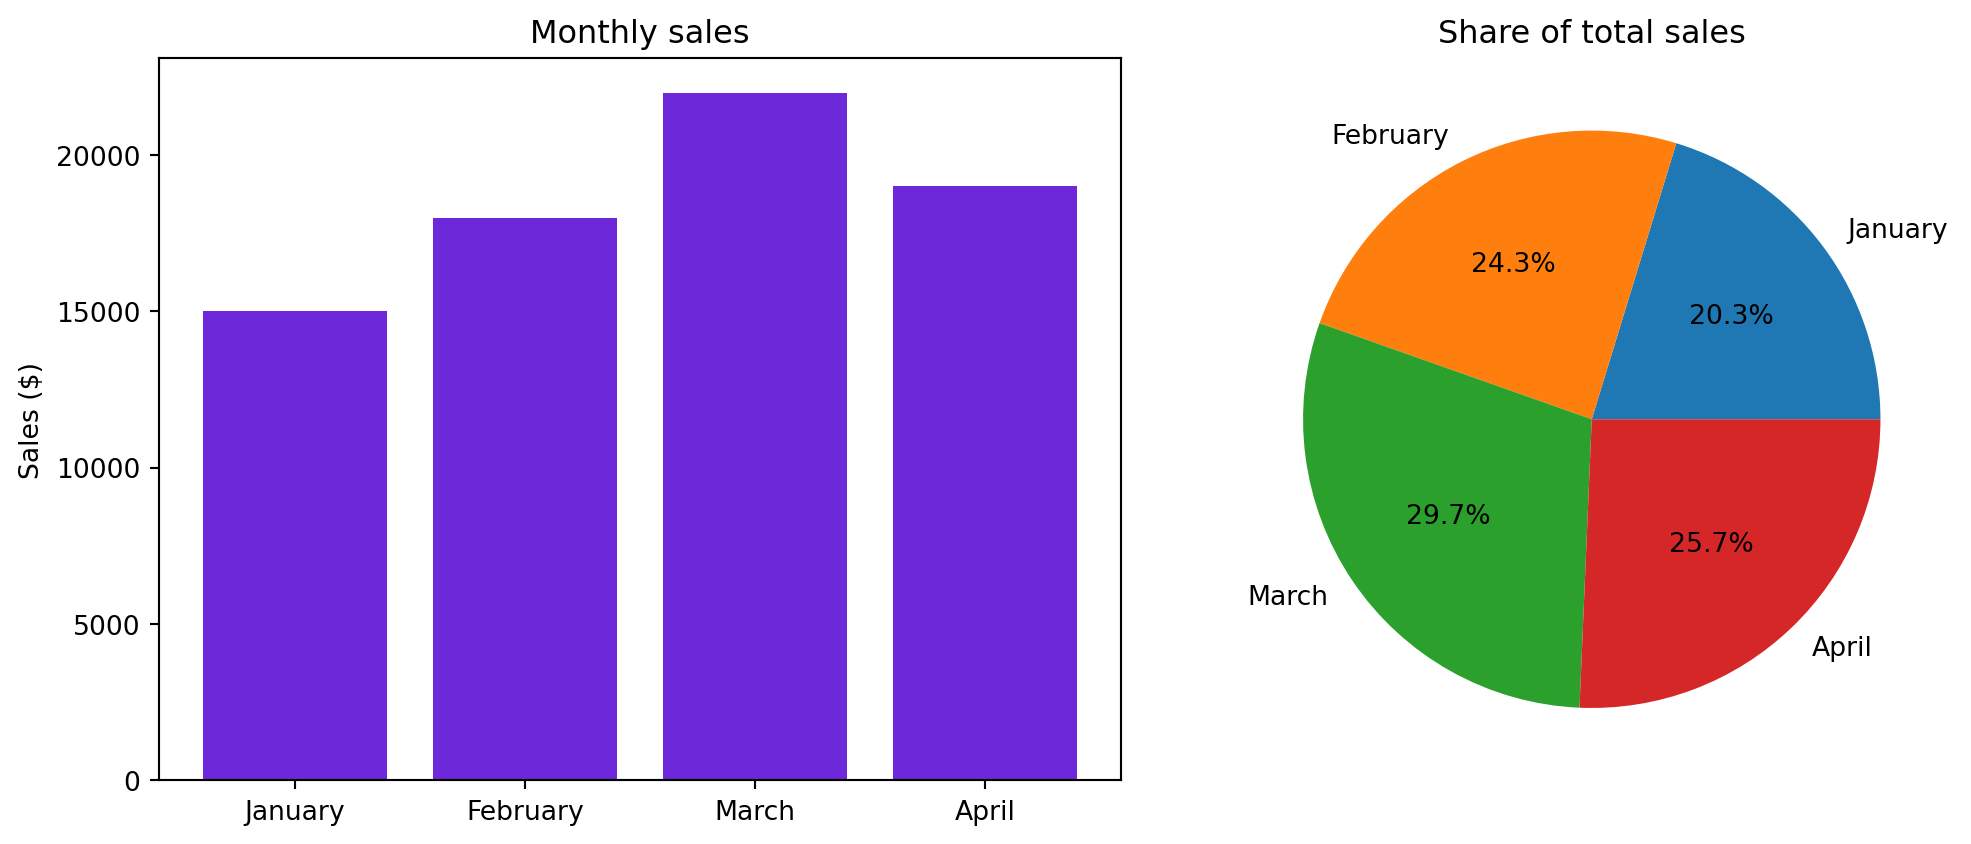
Key ideas
- A bar chart compares values across categories.
- A pie chart shows each part’s share of a total; use it only with a few categories.
- Always label axes and give the chart a title.